New Paper: Monitoring Tree Phenology with Satelllites
Climate change is altering the seasons, causing temporal shifts in spring and autumn. The result is a disruption of the temporal rhythms that have shaped life on Earth. These changes have consequences for the overall functions of ecosystems, as plants and animals may no longer respond in harmony to seasonal cues. “Long-term observations suggest that species adapt to environmental changes at different rates. This can cause formerly synchronised species to fall out of sync, with potential consequences for their ecological interaction”, explains Tiziana Koch, researcher at the Remote Sensing Laboratories at the University of Zurich.
One example of species falling out of sync is forest birds in England where spring begins earlier than it used to. Warmer temperatures cause trees to leaf out and caterpillars to emerge sooner. The birds are struggling to adapt their breeding behaviour to the new conditions, and as a result, chicks may hatch after the peak in food availability.
Satellite data vs field observations
Regions with moderate climates and boreal ecosystems, like the forests in the Swiss Alps, are particularly affected by phenological changes caused by climate change. Forests follow a natural rhythm, that we witness every year. In spring, leaves and new needles emerge and in autumn, they change colour and fall. But increasingly, the timing of these phenological events is shifting. These changes have been observed and studied for decades. Researchers regularly visit selected trees and estimate the dates when specific stages of the phenological calendar are reached - for example, when 50% of the leaves have emerged. These field observations can be very time-consuming and are susceptible to errors that may occur during estimation.
That is why Tiziana Koch is investigating how satellite data can be used for observing phenological changes. “With satellite data, we can observe changes more regularly over time - in some cases even daily. But the real advantage is spatial: instead of watching a single tree, we can monitor entire forests and identify patterns across whole regions.” Satellite data has already been used for some time to observe phenological events. But technological advancements are now opening new possibilities to observe phenological changes of tree species.
“Typically, the spatial resolution is quite coarse, with pixel sizes of 30 to 250 meters, meaning that multiple species are usually mixed within one pixel. This means we are observing phenological changes at the landscape level over time. But with Sentinel-2, we can now go down to pixel sizes of 10 to 20 meters. And that’s what makes it exciting. It allows us to analyse phenology at the species level, for example, for different tree species”, explains Koch.
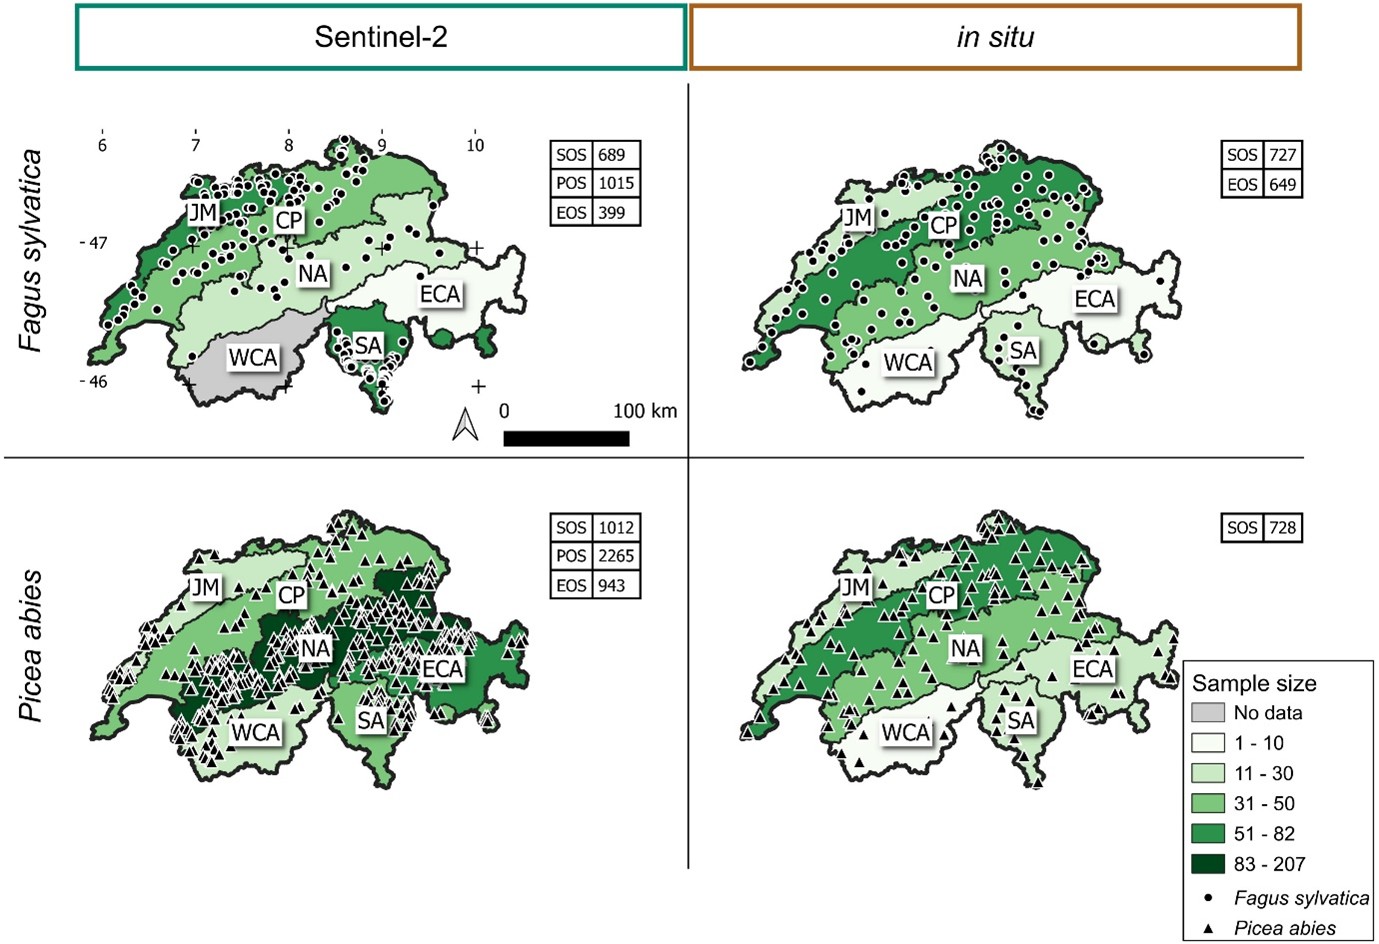
For her research, Koch compared ground-based monitoring data with phenology metrics derived from Sentinel-2 satellite imagery. She focused on Switzerland’s two most common tree species - beech and spruce. As shown in the map above: the two data types do not originate from the exact same locations. However, they are still comparable, as they cover similar elevations, tree species, and climatic conditions. This allows broader patterns in phenology to be detected even when the observation sites do not exactly overlap.
“Sentinel‑2 data were always slightly different from the in-situ observations. For example, the start of season was later, and the end of season earlier. But what's interesting is that the overall patterns remained consistent across regions and years”, summarizes Koch.
In some cases, satellite data may also provide additional insights. The satellite data detected the end of the phenological season (EOS), especially in drought years, spread over time as it is more sensitive to subtle changes across the whole canopy, even if leaves have not yet fallen. Ground observations often record EOS only when visible events occur, such as leaf yellowing or leaf fall on individual trees. This means early stress signals in the canopy can sometimes be missed in field observations.
A complementary data source – not a replacement
But there are still some challenges. In mountain regions, the steep terrain and frequent cloud cover make it harder to get clear satellite images. Shadows from hills or clouds can distort the data, and sometimes there are just not enough good images to work with.
Ground-based observations will not be replaced by satellite data anytime soon. Rather, satellite-derived information serves as a complementary data source that can support forest monitoring, as Koch emphasizes:
“Our results show that satellite data can be a valuable tool for monitoring phenology, especially in large or hard-to-reach areas. However, they do not replace field observations but rather complement them. The added value lies in the fact that both perspectives together provide a more comprehensive picture.”