New Paper: Anisotropy Impacts Forest Surface Temperature Measurements
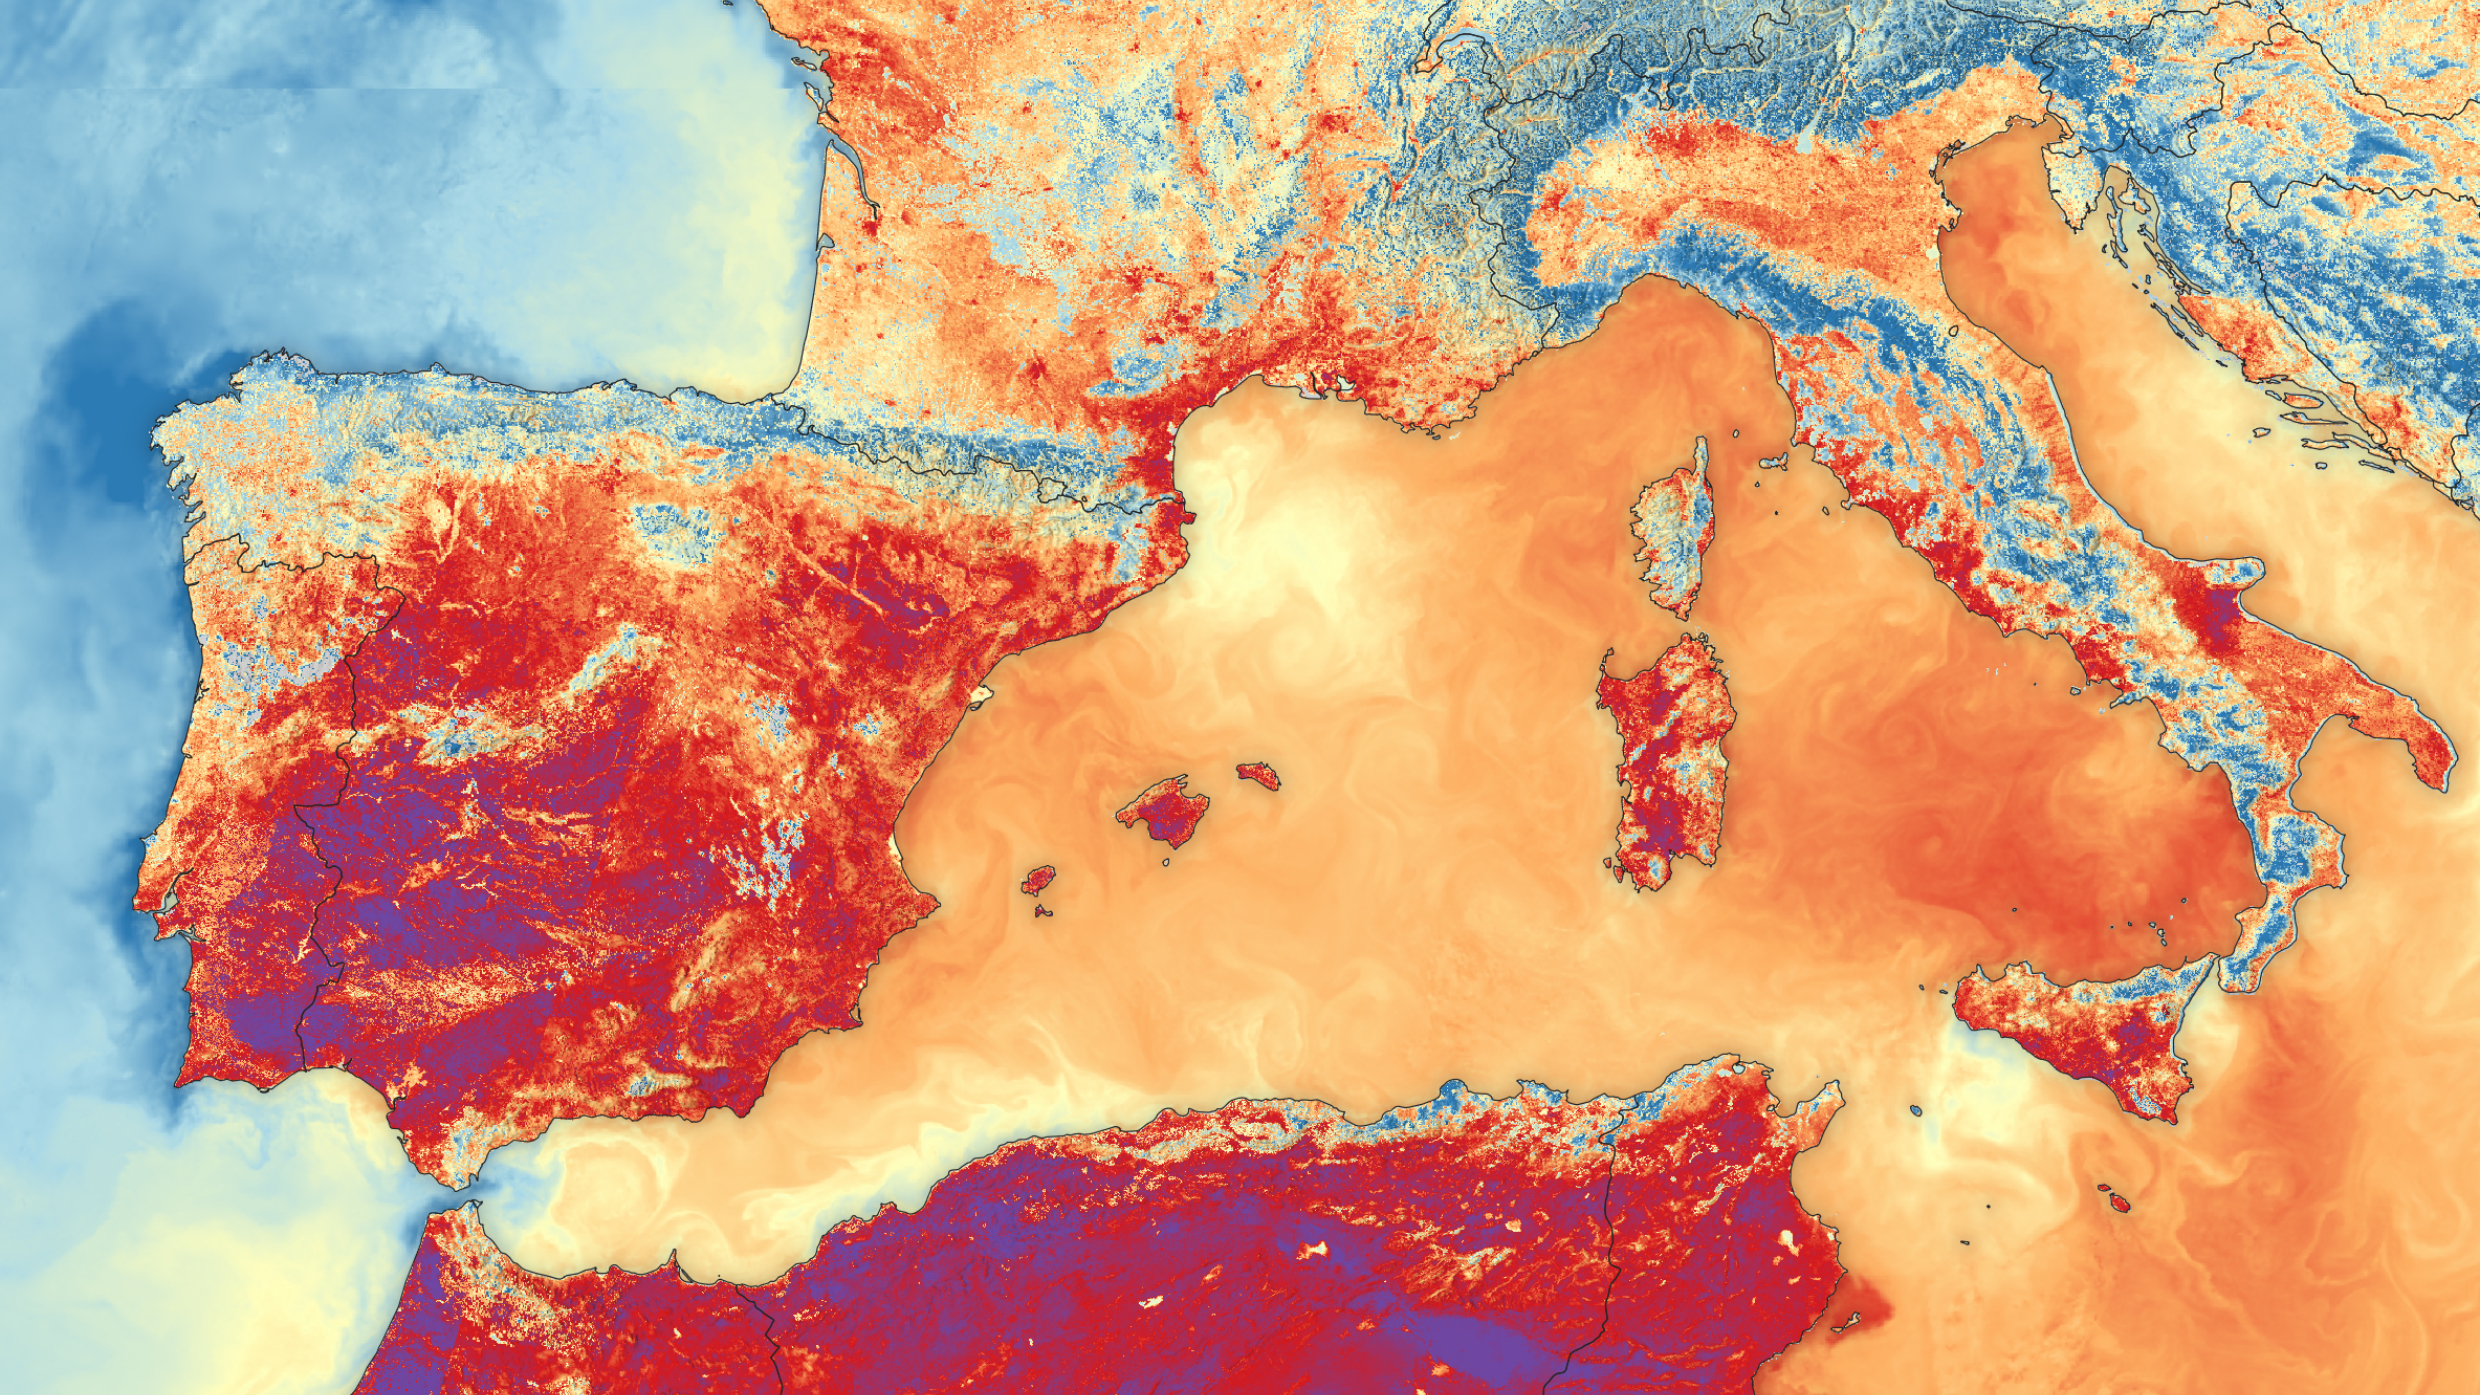
This summer, Southern and Western Europe have experienced extreme heatwaves. June 2025 was the hottest June on record in Western Europe. But not only humans struggle with these extreme temperatures. Europe’s forests are also suffering from heat stress. Periods of extremely high temperatures and drought can impact the growth and productivity of trees. This extreme heat can ultimately contribute to the die-off of tree species.
To study how these changing climatic conditions affect forests, researchers track changes in land surface temperature (LST) and relate them to indicators of forest health. LST can be a measure of how warm or cool forests are, as well as how they cope with extreme events (droughts, heatwaves) and rising temperatures. When forests are healthy and productive, they help keep land surface temperatures lower through processes such as evapotranspiration. During evapotranspiration, trees release water into the atmosphere, which helps to cool down their surroundings. But when trees suffer from heat stress, they might not be able to perform these basic functions. This effect can be ultimately reflected in LST measurements.
Better LST data
To monitor land surface temperature over large areas, scientists use thermal infrared data collected by satellites. Thanks to technological advancements, upcoming sensors will provide LST data at unprecedented temporal and spatial resolutions. In 2026, the French space agency (CNES), together with the Indian Space Research Organization (ISRO), plans to launch the TRISHNA mission. This mission will provide thermal infrared measurements at higher spatial resolution than previously possible. But with these advances also come challenges, with higher resolution data needing extra care and corrections to achieve accurate data. For LST measurements in forests, one of these challenges is the phenomenon of anisotropy.
Anisotropy
In this context, anisotropy means that the temperature a satellite sensor measures can change with sensor viewing and solar angles. Satellites do not always view Earth from directly overhead. Depending on their orbit, sensor design, and sensor position, they can capture data from different angles. The problem: The temperature a sensor observes from straight above, called the nadir view, can differ from what it measures at an angle, the off-nadir view. Additionally, satellites like TRISHNA will have observations impacted by the so-called “hot-spot” effect. This occurs when the sensor and sun are looking in the same direction, therefore fully illuminating leaves and causing a bright spot. Different parts of the forest, for example, a sunlit soil or a shaded vegetation, can radiate heat differently. “If shaded vegetation and sunlit soil are right next to each other, the temperature difference can be substantial, sometimes 10 to 15 degrees,” explains Adams.
“With these new high-resolution missions, anisotropy becomes a much bigger factor,” says Adams. “Before, with lower resolution at the kilometre scale, anisotropy effectively averages out. But at fine resolution, you see sharp contrasts between sunlit and shaded areas, as well as differences in temperatures between different parts of the forests, such as soil and leaves.” To better understand this effect, Jennifer Adams conducted a laboratory experiment. In doing so, she addressed a research gap.
The impact of anisotropy on LST measurements of forests has so far received little attention. Adams explained that monitoring anisotropy in vegetation has mostly focused on agricultural crops rather than forests. This is partly due to the focus of satellite missions on monitoring crop temperatures and its input to evapotranspiration products as well as the high levels of anisotropy observed in LST data over crop fields. Forests, on the other hand, are challenging to study anisotropy: “They are very dense. They are very high. They are in places that are not necessarily very easy to reach,” notes Adams. This makes anisotropy measurements and modelling a difficult task.
Miniature forests
This challenge comes from the need to isolate the effect of anisotropy and to control for other possible influencing factors. To study the impact of anisotropy, the position of the sun should remain the same while the forest is observed from different angles. In the field, this is not easy to achieve. While moving a sensor to replicate different viewing angles, the sun moves. As a result, the position and length of shadows change, which also changes which parts of the canopy or forest floor are illuminated and how much heat they emit as radiation. Adams found a way to address this challenge by creating a controlled setting and adapting a method, which has already been used in optical remote sensing research: micro-canopies or miniature forests.

“The idea was to adapt what had been done in the optical domain and test whether it could also work for thermal measurements,” she recalls. Micro-canopies are models that replicate forest structures. Adams created miniature forest scenes from real plants. “We used spherical plants to mimic tree crowns. We scaled them down so that their size relative to our sensor matched the relationship between actual trees and a satellite pixel,” she explains. To replicate real forest conditions, Adams built the micro canopies in a way that mimics their structure. To compare different forest structures, she built two types of micro canopies: homogeneous and heterogeneous tree canopies. Heterogeneous canopies represent a variable structure and composition of trees, while homogeneous canopies are more uniform, and, as Adams expected, will show fewer anisotropy effects.
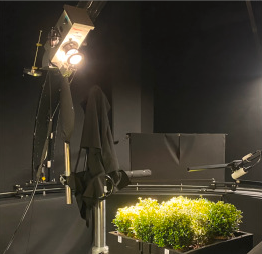
To create controlled conditions for her experiment, Adams used LAGOS, a laboratory goniometer system designed by the University of Zurich (UZH).
This system sat in the center of a darkened room: two intersecting arcs on a rigid frame. One arc carried the light source, a halogen lamp, the other the thermal infrared radiometer. The micro-canopies were placed at the center, and the goniometer rotated around them to capture different viewing angles.
Understanding uncertainty
Adams’ experiments confirmed what she had suspected: “As expected from literature, heterogeneous canopies had much stronger anisotropy than homogeneous ones, especially at medium vegetation cover where gaps of sunlit or shaded soil and canopy temperatures occur most,” says Adams.
The study also showed that the extent of anisotropy depended on the density of the canopy as well as on the angle from which it was observed. The effect was smallest when the sensor looked straight down from above but increased as the view shifted to the side. The differences were the strongest when the canopy was irregular, for example, when gaps in the foliage exposed patches of sunlit soil.
The study’s findings can help to assess better the uncertainties that anisotropy poses for interpreting thermal data. “This provides numbers on the uncertainty anisotropy introduces,” Adams points out, “and offers a dataset to help validate or benchmark the correction models that missions like TRISHNA are developing.”